In this lesson, we will learn how to use matplotlib to draw simple lines.
20.1 Brief description
Matplotlib is a plotting library for the Python programming language and its numerical mathematics extension NumPy. It provides an object-oriented API for embedding plots into applications using general-purpose GUI toolkits like Tkinter, wxPython, Qt, or GTK+. There is also a procedural "pylab" interface based on a state machine (like OpenGL), designed to closely resemble that of MATLAB, though its use is discouraged.[3] SciPy makes use of Matplotlib.
Matplotlib was originally written by John D. Hunter, since then it has an active development community,[4] and is distributed under a BSD-style license. Michael Droettboom was nominated as matplotlib's lead developer shortly before John Hunter's death in August 2012,[5] and further joined by Thomas Caswell.
20.2 Learning the code program of linkageM.py
Here we use Subline IDE to view and edit the code program of this course. For the specific method, please see "2.4 Editing the Code Program in Raspberry Pi" in Lesson 2.
In the file manager of the MobaXterm terminal, find adeept_rasparms/CourseCode, download the 08linkageM folder to your PC, select this folder, click the button  to download the file to the PC, save it in the path of English letters, and use Subline IDE opens linkageM.py in the 08linkageM folder. The main code and comments are as follows:
Import numpy.

Import matplotlib.

The function drawLine() is used to input the coordinates pos1 of the initial point of the line segment and the coordinates pos2 of the end point.

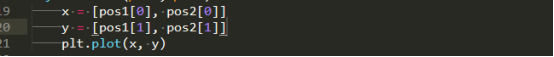
In the drawLine() function, X represents an array of X points, and Y represents an array of Y points. Use plt.plot(x, y) to draw this line segment.
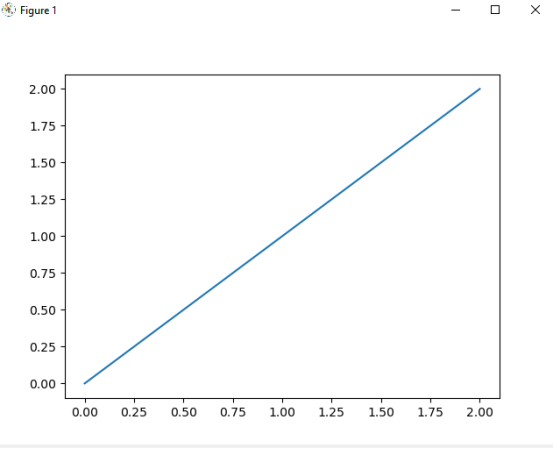
Call the drawLine() function to draw a line segment starting at (0,0) and ending at (2,2).

Show the drawn line.

20.3 Running the linkageM.py program on the PC
Find the folder 08linkageM you downloaded in step 20.2 on your PC, copy the linkageM.py program inside to the C drive directory, and double-click to open the linkageM.py program inside. Make sure you have followed Lesson 4 to download and install Python.
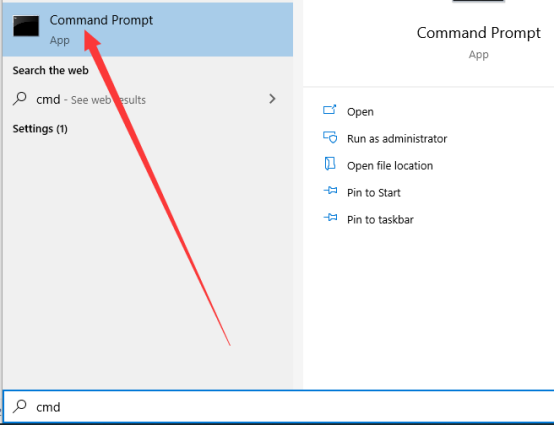
1. First open the cmd command window on the PC:
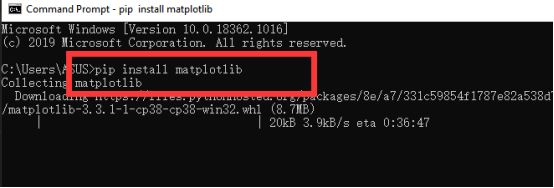
2. In the opened command window, enter the command to install matplotlib:
pip install matplotlib
3. After the installation is complete, you can use the mouse to double-click to open the linkageM.py, and then you will see the following picture, the middle is the line segment drawn by the program.