In this lesson, we will learn how to use matplotlib for dual-view linkage simulation.
22.1 Brief description
Matplotlib is a plotting library for the Python programming language and its numerical mathematics extension NumPy. It provides an object-oriented API for embedding plots into applications using general-purpose GUI toolkits like Tkinter, wxPython, Qt, or GTK+. There is also a procedural "pylab" interface based on a state machine (like OpenGL), designed to closely resemble that of MATLAB, though its use is discouraged. SciPy makes use of Matplotlib.
Matplotlib was originally written by John D. Hunter, since then it has an active development community and is distributed under a BSD-style license. Michael Droettboom was nominated as matplotlib's lead developer shortly before John Hunter's death in August 2012, and further joined by Thomas Caswell.
22.2 Learning the code program of linkage.py
Here we use Subline IDE to view and edit the code program of this course. For the specific method, please see "2.4 Editing the Code Program in Raspberry Pi" in Lesson 2.
In the file manager of the MobaXterm terminal, find the adeept_rasparms/CourseCode, download the folder 10linkage to your PC, select this folder, click the button to download the file to the PC, save it in the path of English letters, and use The Subline IDE opens the linkage.py in the 10linkage folder. The main code and comments are as follows:
Import numpy.

Import matplotlib.

Import the library for animation.

Here defines the distance between the A-axis of the servo and the servo axis responsible for the left and right swings. This distance is determined by the structure and cannot be changed.

Define the position of the oscillating servo here to correct the initial position error, generally 0 is enough.

Define the text size.

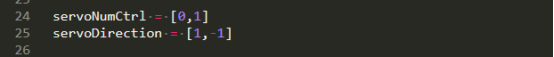
servoNumCtrl = [0,1] is the number of the AB servos; servoDirection = [1,-1] corresponds to the movement direction of the AB servos, set by 1 and -1.
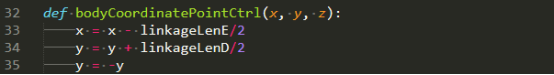
This function is used to input the three-dimensional coordinates of the end point of the link, and return the rotation angle of the left and right swing servo and the length of the yellow line segment.
[Important Reminder]:
The length of the yellow line segment is the X value of the link inverse solution function of the previous course, and the Z value here is the Y value of the link inverse solution function of the previous course.
The function used to draw the line segment is the same as in the previous lesson.
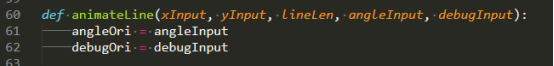
The Animate() function is responsible for generating animation, the i value inside the function is the input variable.

Return the rotation angle of the left and right servo and the length of the yellow line segment.

Call the animateLine() function to draw the line segment.

Apply animation to linkage.

Show some key information on the link.

Note here that there must be a',' after the last return value, do not delete.

Create a new artboard for animation drawing.
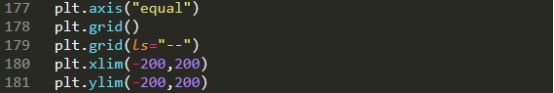
Use animation to define range() to determine the range of animation variables.

Display simulation motion model.

22.3 Running the linkage.py program on the PC
On your PC, find the folder 10linkage that you downloaded in step 22.2, copy the linkage.py program inside to the C drive directory, and double-click to open the linkage.py program inside. Make sure you have downloaded in accordance with “Lesson 4 Downloading and Installing Python".
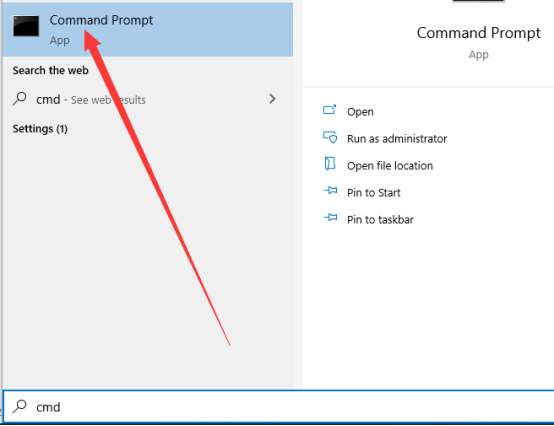
1. First open the cmd command window on the PC:
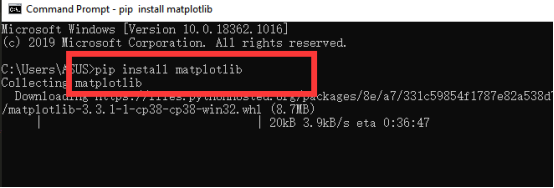
2. In the opened command window, enter the command to install matplotlib:
pip install matplotlib
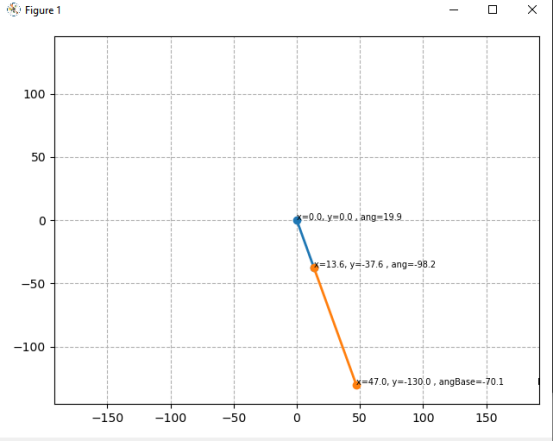
3. After the installation is complete, you can use the mouse to double-click to run linkage.py, and then you will see the following figure, which is the matplotlib's dual-view linkage simulation.